DIVERSITY & POLITICS
The Liberal government and the Trudeau Cabinet
Justin Trudeau appointed a Cabinet (30 positions)¹ that is half female as well as almost one quarter (23%) minority. Both these shares, prima facie, seem “fair” in the sense that they are representative of the population. (The Trudeau Cabinet also counts 7 French speakers, which works out to 23% of the Cabinet positions — a number also in line with the French-speaking share of the national population.) In fact, ethnic minorities — i.e. visible minorities plus Aboriginals — constitute slightly more than a quarter (26%) of the Canadian population (2015).² East Asians and South Asians are the two most prominent ethnic minority groups, with each accounting for approximately 20% of the overall minority population (~8 million). In contrast to the United States where Latin American (Hispanics) and Blacks are the dominant minority groups, within Canada they are just a small share of the minority population.
Chart I: The distribution of minority groups within Canada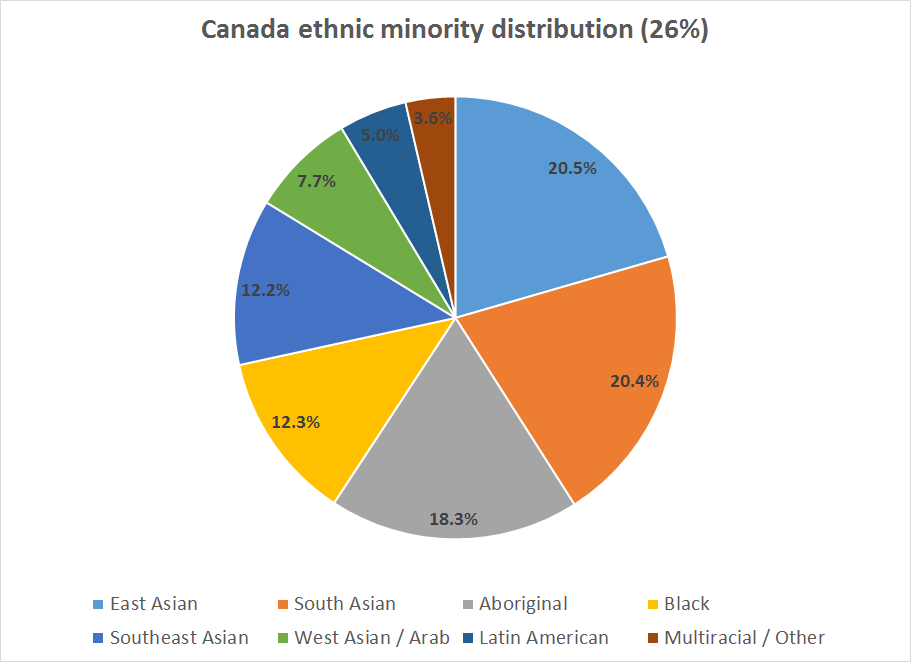
The Trudeau Liberal government itself (184 MPs) is over one quarter (27%) female and almost one quarter (24%) minority. However, some ethnic communities are more well represented than others within the Liberal government. South Asians account for nearly half (45%) of the minority population of Liberal MPs, and West Asians / Arabs account for a quarter (25%). These shares are much higher than within the general population. On the other hand, East Asians are the largest ethnic minority group but are surpassed by almost all other ethnic groups in the Liberal caucus, while Southeast Asians are completely absent.
Chart II: The distribution of minority MPs within the Liberal government of Canada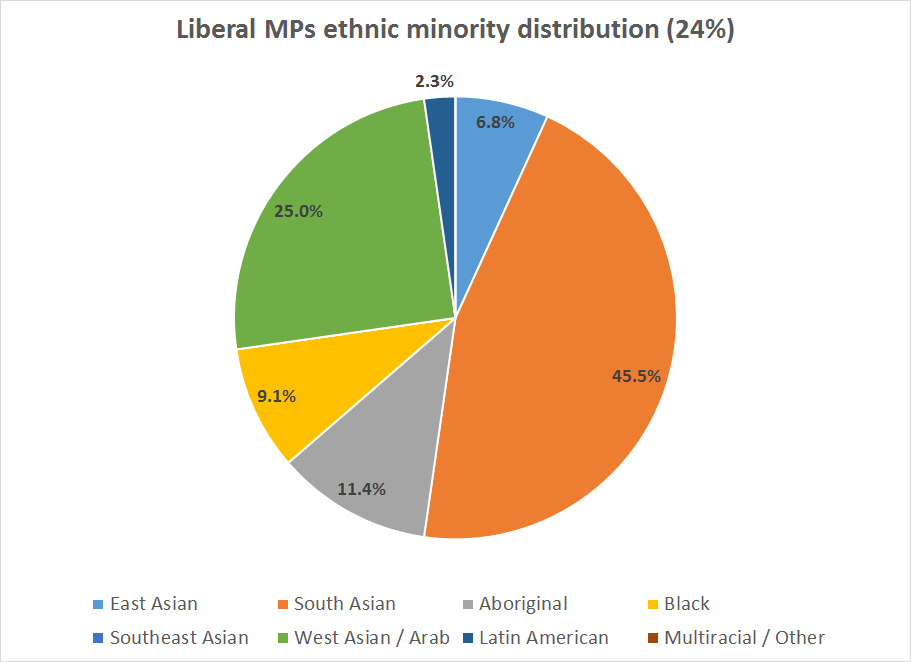
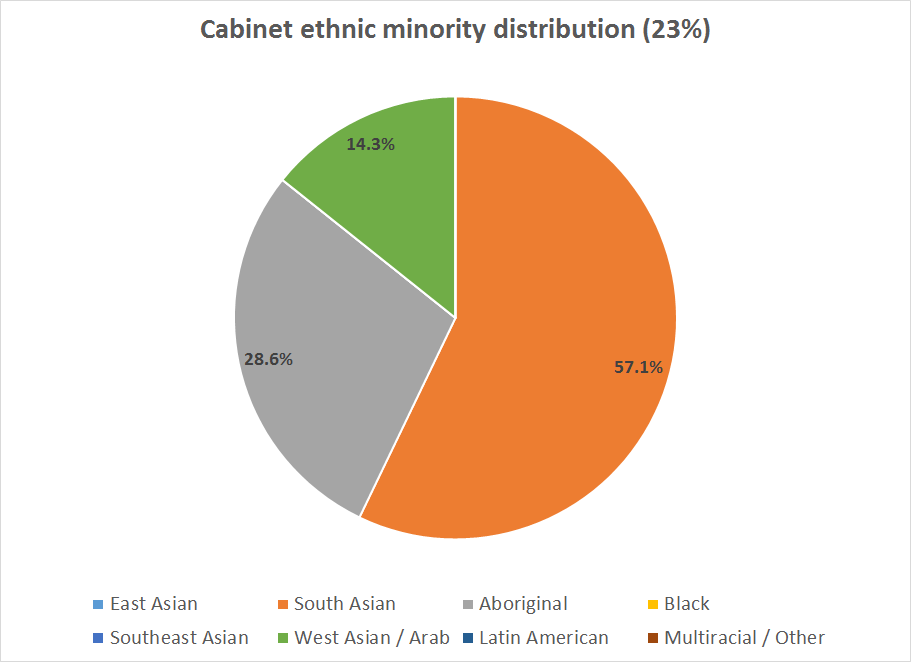
Cabinet is where the true power resides within Parliament. Here, the Trudeau Cabinet has been described as diverse owing to the high number of minorities appointed. However, within that “diversity” there is homogeneity, with South Asians accounting for more than half (57%) of the minority positions in Cabinet. And the only other minority groups with a seat at the Cabinet table are Aboriginal and West Asian / Arab. It is worth noting that East Asians — the largest minority group — are completely absent from Cabinet. Moreover, the East Asian, black, southeast Asian and Latin American communities collectively constitute 13% of the general population, yet are unrepresented in Cabinet.
Trudeau picked a Cabinet that is 50% women even though the pool of eligible MPs is just 27% female,³ presumably to align with the demographics of Canada. And a quarter of Cabinet is also of minority background — again aligned with demographics. Even the French-speaking share of Cabinet appears to have been deliberately chosen to reflect their share of the population. However, the principle of demographics appears to have been applied at an aggregate level for minorities, rather than at a micro level. This has led to a proportionate non-White representation within Cabinet, but the minorities of Cabinet are not necessarily reflective of the mosaic of Canada. Treating minorities as one homogeneous group is clearly wrong given the heterogeneity of minorities — even within each community there is a lot of diversity. Yet it would appear that the choice of minority Cabinet appointments did not take into account the diversity of that group.
Ultimately, the appointment of Cabinet positions is a zero-sum game as placements for one group are necessarily posts excluded for others. Thus the (obvious) omission of some groups — while others are (necessarily) over-represented (relative to the principle of demographics) — seems to be a negative byproduct of having a one-dimensional view of minorities in Canada.
Chart III: The distribution of minority positions within the Trudeau Cabinet
A detailed analysis of the cabinet can be found here: “Facts about the Trudeau cabinet.”
1. Inclusive of Justin Trudeau, the Cabinet counts 31 positions.
2. StatsCanada 2011 Census projected to 2015
3. Presumably he would choose from within the Liberal caucus
Who are the ruling elite?
It is well known that politicians tend to be a homogeneous group. They are typically from the majority group (i.e. white with respect to the western world) and male. They also often tend to come from similar backgrounds — attending the same (often elite) schools, and having studied or worked in high-powered (and often clubby) sectors (e.g. law). My own research (Chan, 2014) has confirmed these traits for Canadian federal politicians: “Canada’s governing class: Who rules the country?” (PDF 3.23 MB).*
The below charts highlight some of the major findings from the report on the the composition of Canada’s governing class (41st session of Parliament and the senators sitting as of 1 September 2014). Notably, the first chart shows that there are 107 “extra” white males, 64 “missing” white females and 45 “missing” minorities in the Parliament of Canada (relative to each’s share of the national population). The second chart shows that the ruling class has a high level of formal post-secondary education (73.4%), and that amongst the parties, that the Liberals are the most educated in Parliament. The third chart shows that a large share of parliamentarians (who completed post-secondary education) attended one of the elite universities in Canada. The fourth chart shows the split by gender for the top-15 universities. The fifth chart illustrates that the vast majority of Canadian federal politicians come from arts, law, business and education backgrounds — very few have STEM backgrounds. The sixth chart measures how representative Parliament and each of the political parties are of the nation on a socio-demographic basis. That is, if a random group of 100 Canadians were chosen — it would (on average) consist of 50 women, 23 minorities and 23 French speakers — how would Parliament and the political parties compare with that group? The data show that Liberals are the party that most resemble Canada, while the Conservatives least look like the country.
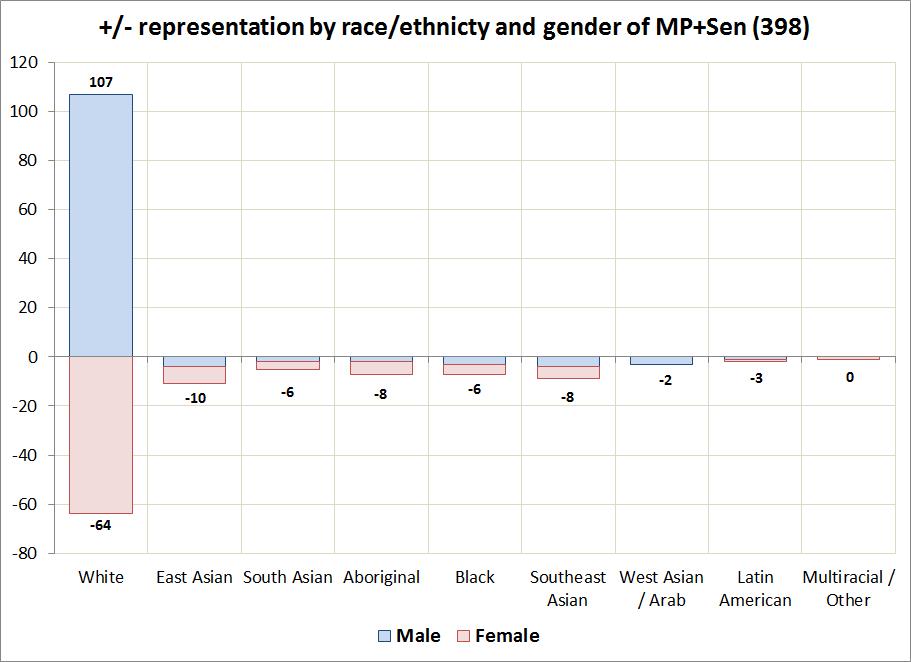 Chart 1: The “extra” and “missing” parliamentarians by gender and ethnicity (Chan, 2014).
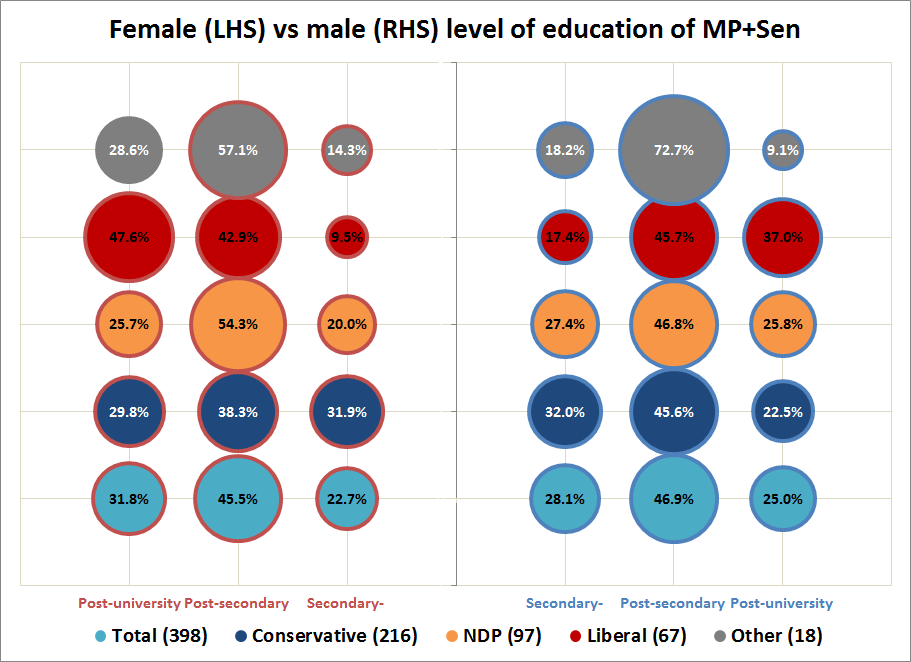 Chart 2: Highest level of educational attainment by gender (LHS = female, RHS = male) and political affiliation of parliamentarians (Chan, 2014).
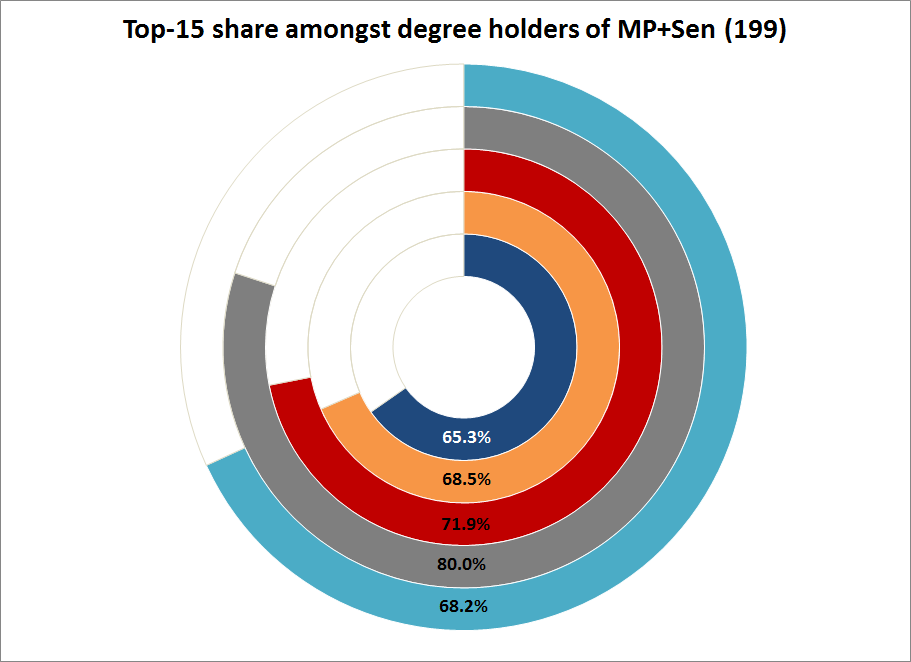 Chart 3: The share of parliamentarians with post-secondary qualifications that studied at one of Canada’s top-15 doctoral/medical universities (Chan, 2014).
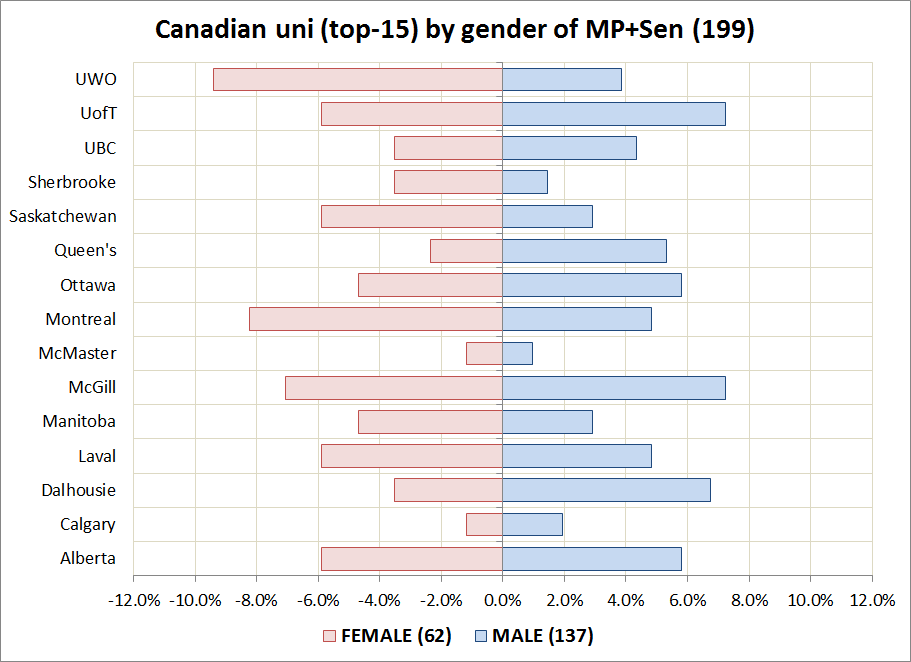 Chart 4: The top-15 universities parliamentarians attended, split by gender (Chan, 2014).
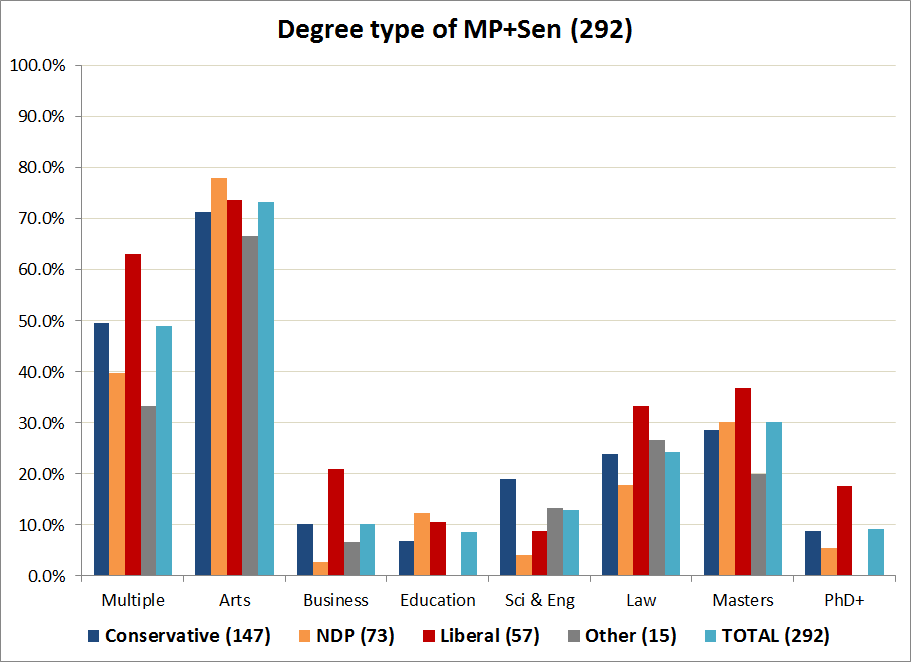 Chart 5: Degree types obtained by parliamentarians split by political affiliation (Chan, 2014). NB: Multiple includes any level of degrees — e.g. a bachelor in arts and a bachelor in law.
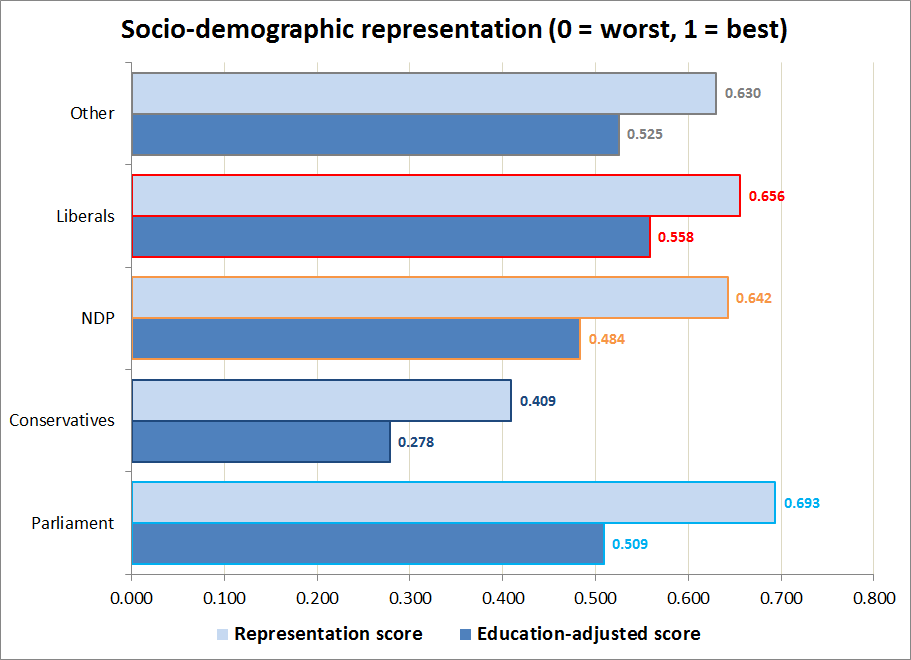 Chart 6: The diversity of Parliament and the political parties on a socio-demographics basis. A score of 0 least resembles Canada; a score of 1 most resembles Canada (Chan, 2014).
The Toronto elite (WIP)
The above showed the socio-demographic characteristics of Canada’s government. The data clearly present a governing class that is not in line with the demographics of the country and which is also heavily skewed to certain educational and vocational backgrounds. A question that naturally arises, then, is whether such dynamics exist in the marketplace? An interesting case study then is to examine the composition of Toronto’s elite — a group that is comprised of both government and private market movers and shakers.
The under-representation of women and minorities in the Canadian federal government is vastly overshadowed by the disparities in the Toronto elite. In a city where half of residents are minorities, their presence in the elite is less than 15 percent and women number under 20 percent. The fact that women and minorities both account for about half of the population allows for some direct comparisons between the so-called “glass ceiling” (for women) and the “rainbow ceiling” (for minorities).
With respect to educational credentials, the Toronto elite
**********************************
* The database for the socio-demographics of Canada’s MPs and senators is here: Canada’s_governing_class_v1.0.xlsx. If errors, omissions or updates are spotted/needed to the database, please email me at
References:
Chan, Kai L. (2014). “Canada’s governing class: Who rules the country?” Working paper.