‘We live in a globalized world,’ House most ethnically diverse in Canadian history, but still has long way to go: research
‘We live in a globalized world,’ House most ethnically diverse in Canadian history, but still has long way to go: research
A record 47 visible minority and 10 indigenous MPs were elected in this House.

PUBLISHED : Monday, Nov. 21, 2016 12:00 AM
PARLIAMENT HILL—It’s the most ethnically diverse House of Commons in Canadian history, but it still has a long way to go.
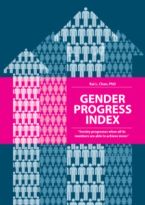
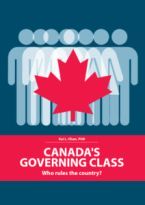
The House is still mostly white, male, and English-speaking, according to a study conducted by Kai Chan, who released his data to The Hill Times, and most MPs are married, 30 per cent are bilingual, 13 per cent were born outside Canada, women make up 26 per cent of the House, 14 per cent are visible minorities, three per cent are indigenous, most studied politics, most were lawyers, and most have post-secondary education.
Among the 338 MPs elected in the last general election, the most common age group is 50-59, 214 MPs are married, and 26 MPs have four or more children, according to Mr. Chan, an expatriate Canadian economist who now resides in the United Arab Emirates and who holds a PhD in economics from Princeton University in Princeton, New Jersey.
His research also revealed that 104 MPs, or 30 per cent, elected in the last general election are bilingual; 47 MPs, or 14 per cent, were born outside of Canada; and women make up 88, or 26 per cent, of the House of Commons. Of the 47 MPs, or 14 per cent, who were born outside of Canada, 11 were born in India; six in the U.K.; and four in Lebanon. And the 291 MPs, or 86 per cent, who were born in Canada, 28 MPs, or about 10 per cent, were born in Montreal; 25 MPs, or nine per cent, in Toronto; and 12 MPs, or four per cent, in Winnipeg.
The last federal election delivered a landslide majority government for Prime Minister Justin Trudeau’s (Papineau, Que.) Liberals and elected the most diverse group of MPs with a record 47 visible minority MPs, 10 indigenous MPs, and 88 female MPs.
Visible minorities make up about 19 per cent of the total Canadian population and the 47 visible minority MPs form about 14 per cent of the current House. Also, indigenous peoples make up about four per cent of Canada’s population, but the 10 MPs constitute about three per cent of the House.
In the last election, the Liberals won 184 seats, the Conservatives won 99, the NDP 44, the Bloc 10, and the Green Party won one seat.
The 184-member Liberal caucus includes 39 MPs from visible minorities and eight indigenous MPs. In total, MPs of colour from 25.5 per cent of the caucus.
In the 99-member Conservative caucus, six MPs are visible minorities but there are no indigenous MPs. Visible minorities represent six per cent of the Conservative caucus.
The NDP elected two MPs each from visible minorities and indigenous Canadians and they represent nine per cent of the caucus.
In the 2011 election, there were a total of 308 seats in the House, but the Commons increased by 30 seats in the last election. In the 2011 election, 28 MPs were visible minorities and seven were indigenous MPs. The Conservatives, under former prime minister Stephen Harper, won the government with 166 seats, followed by the NDP with 103 seats, the Liberals 34, Bloc Québécois four, and the Green Party one seat.
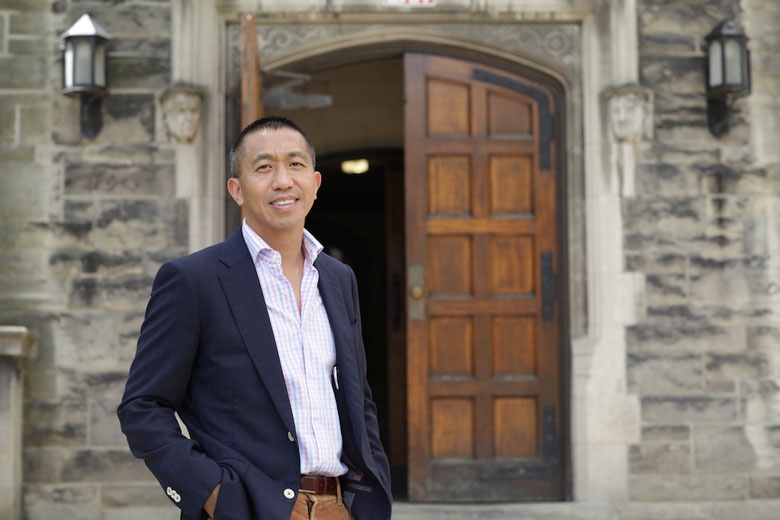
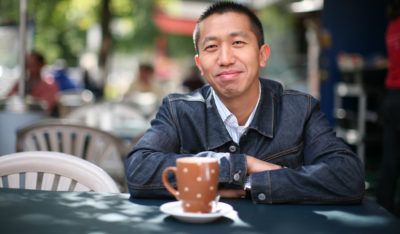
This is the second time that Mr. Chan, 41, who was born in China but emigrated to Toronto at the age of four with his parents, conducted his democratic research on MPs. The first time was in 2014 on MPs who were elected in the 2011 federal election. Mr. Chan, a distinguished fellow with INSEAD, a graduate business school in Abu Dhabi, said he’s interested in the demographics of the House of Commons. He said he relied on a variety of sources to conduct his research including parliamentary, political parties’ and personal websites of MPs, as well as other publicly available data.
Mr. Chan’s research revealed that when it comes to age, seven MPs, or two per cent, in the current Parliament are under the age of 30, while 12 MPs, or three per cent, are over age of 70. The majority, 110 MPs, or 32 per cent, are between 50 and 59 years old; 89 MPs, or 26 per cent, are between 40-49; 68 MPs, or 20 per cent, are between 60-69; and 52 MPs, or 15 per cent, are between 30 and 39 years old.
The national average age is 40.6.
The Bloc Québécois’ caucus is the youngest with the median age of 43; the NDP’s caucus average age is 49.5; the Liberals’ average age is 50; and the Conservatives’ average age is 52.
In the most common occupation category, Canadians elected 60 MPs who are lawyers, or 18 per cent; 47 MPs, or 14 per cent, are consultants; 43 MPs, or about 12 per cent, are professors; 42 MPs are businesspeople and 41 MPs are executives. Some 63 MPs studied politics, 60 studied law, 27 studied business and 27 studied economics.
As for language proficiency, 104 MPs, or 31 per cent, described both English and French as their preferred language of communication; 199 MPs, or 58.9 per cent, prefer English; and 35 MPs, or 10 per cent, prefer French only.
In the marital status category, 214 MPs, or 63 per cent, are married and 124 MPs, or 37 per cent, are in the unmarried or unknown category.
Mr. Chan’s study also found that 24 MPs have one child; 80 have two children; 58 have three children; and 26 have four or more children. Some 150 MPs either have no child or it was unknown if they have any children.
In the education category, Mr. Chan discovered that a 257 MPs, or 76 per cent, have some sort of post secondary education. Some 16 MPs, or four per cent, have a college diploma, 136 MPs, or 40 per cent, have a bachelor’s degree, 75, or 22 per cent, have a master’s degree and 30 MPs, or eight per cent, have a PhD.
Some 81 MPs have secondary or a lower level of education.
The Liberals lead the pack with 22 MPs who have doctorates, followed by the Conservatives with five MPs, the NDP two, and Bloc one MP.
The Conservatives have the highest number of MPs who have either secondary or lower education with 42 MPs, followed by Liberals with 27, the NDP with eight and the Bloc with four MPs. The Liberals are far ahead of other parties when it comes to MPs who have master’s or bachelor’s degrees with 47 and 82, respectively. In the Conservative caucus, 14 MPs have their master’s degree and 31 MPs have their bachelor’s. On the NDP side, 12 MPs have their master’s and 19 have their bachelor’s degrees.
Amongst MPs who earned their post-secondary education, 32 attended the University of Toronto, 22 went to McGill University in Montreal and 16 attended Queen’s University in Kingston, Ont.
In an interview with The Hill Times, Mr. Chan described himself as “data junkie” and someone who is curious about Canadian politics.
He said the current House is one of the most diverse in the history of Canada, but also said more work needs to be done to improve the representation of visible minorities in the Commons proportional to Canada’s overall population. He also pointed out that some visible minority groups, such as South Asians and West Asians are overrepresented in the Parliament while most others are underrepresented.
According to the 2011 National Household Survey, the total Canadian population is 32.8-million. Of that, 6.2-million, or 19 per cent, are visible minority Canadians, including 1.5-million South Asians, 1.3-million Chinese Canadians, and about 945,665 black Canadians. The Filipino Canadian population numbers 619,310, the Canadian Latin American 381,280, the Canadian Arab 380,620, the Canadian Southeast Asian 312,080 and the Canadian West Asian 206,840. And the total aboriginal population is 1.4-million.
South Asian Canadians make up 25 per cent of the total visible minority population, but elected 51 per cent of the 47 visible minority MPs in the last election. West Asian Canadian make up 3.3 per cent of Canada’s visible minorities, but won 21 per cent of the visible minority MPs, and Chinese and Southeast Asian Canadians form about 26 per cent of the visible minority population, but only 12.7 per cent of MPs from this heritage are represented in the Commons.
“Canada is such a diverse country, it’s good to get all different voices,” Mr. Chan said. “It’s especially good because we live in a globalized world, and for Canada to really capitalize on its demographic dividend, we really should have all those people at the table.”
Mr. Chan added that all political parties must make an effort to recruit more candidates from visible minorities who are still underrepresented in the Parliament.
Pollster Greg Lyle of Innovative Research in an interview with The Hill Times said that the election of a record number of visible minorities in the last federal election sent a strong signal to all Canadians including visible minorities that they can win in the next election too. He predicted that with this message, more Canadians from visible minorities will run for federal office next time.
“It might create the mobilization within the Chinese community that say, ‘Well, if the doors are open for the visible minorities, let’s say it’s open to us too,’” said Mr. Lyle.
Rookie Liberal MP Geng Tan (Don Valley North, Ont.), who was born in China and moved to Canada about two decades ago, said the relatively low representation of East Asian Canadians in the House is likely because, as new immigrants, most people from his community are more focused on establishing themselves and families first in their adopted, new country.
Mr. Tan said his and the success of other MPs of East Asian origin may inspire others from this community to seek political office at all levels of government. Mr. Tan predicted that a significant number of Chinese Canadian candidates will run at all levels of government across the country in the coming months and years.
“I can sense there will be some change from those communities,” said Mr. Tan.
(More tables on the demographics of parliament available on-line here.)
Article as it appeared on The Hill Times.
© 2016 Hill Times Publishing